

This website is no longer maintained. Please be aware that the content may be out of date or inaccurate. If you have any questions get in touch.
First published 14th July 2017.
Introduction
Conductivity of a solution appears a very simple measurement. Probe goes in, number comes out. Simple? However, whether that number has any meaning requires slightly more careful handling. In order to get reliable data, there are certain ideas that need to be taken into account.
DISCLAIMER: I am not an expert in conductivity measurements. The content of this blog is what I have discovered through my efforts to understand the subject. I have done my best to make the information here in as accurate as possible. If you spot any errors or admissions, or have any comments, please let me know.
Conductivity
Conductivity is an important measurement for many applications [1,2]. When done properly it is a quick and easy way to measure the purity of water. However, there are some key ideas that must be understood before starting to make conductivity measurements.
To start there are three important definitions:
- Electrical current is the movement of charged particles (measured in Amps, A).
- Conductance is a measure of how easily those charge particles move through a solution/material (measured in Siemens, S).
- Conductivity is the conductance (S) measured across a specified distance through a material/solution (measured in Siemens per centimetre, S/cm)
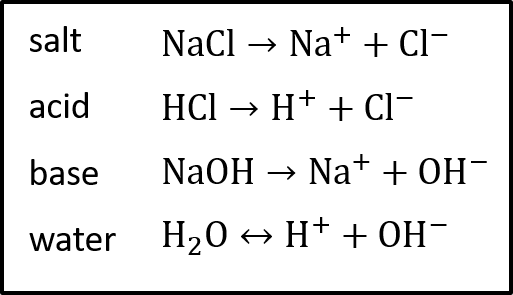
In a metal wire it is electrons that are the charged particles moving through the material, in a solution it is ions. Examples of these ions are shown in Figure 1.
The size of the current depends on [3, 5]:
- Nature of the ions: charge, size and mobility
- Nature of the solvent: dielectric constant and viscosity
- Concentration of ions: the more ions the greater the conductivity and so conductivity can be used as a measure of concentration.
- Temperature
In general the more ions present in a solution the greater the conductivity; however, not all additions to aqueous solutions reliably form ions ( e.g. sugar and alcohol). Further, conductivity only increases with concentration up to a maximum value, after which, the conductivity may actually decrease with increasing concentration [8].
The stability and purity of the sample, and how it is handled, can affect the accuracy of the sample reading. Low-level samples can be easily effected by contamination, CO2 absorption, and degassing [3].
Resistivity
For some solutions, such as pure water, the conductivity is so low that it is sometimes easier to use resistivity and resistance as the measure.
- Resistance is a measurement of a material or solutions opposition to the flow of a current (measured in Ohms (Ω)) . This is the reciprocal of conductance.
- Resistivity is the resistance measured across a specified distance (measured in Siemens per centimeter (Ωcm)). This is the reciprocal of conductivity.
See Figure 2 for comparison of conductivity and resistivitiy. These values range from ultra clean water with a conductivity of 0.055 μS/cm to 30 wt% nitric acid with a conductivity of 861,000 μS/cm.

Concentration and Total dissolved Solids (TDS)
The relationship between conductivity and the number of ions in solution means that it can be used to measure solution concentration and give a value for Total Dissolved Solids (TDS). However, conductivity is non-specific; all ions contribute to the electrolytic conductivity of the solution and one set of ions cannot be distinguished from another [3]. This means that measurements are of the total concentration of ions in solution not the concentration of any one ion.
- Concentration: Some species ionize more completely in water (e.g. NaCl & HCl) than others do [5]. This means that their solutions are more conductive as a result. Each acid, base, or salt has its own characteristic curve for concentration vs. conductivity. A calibration is required with solutions of known composition and concentration.
- TDS: There are lots of assumptions when calculating a TDS value from a conductivity value [5]. In general, a conversion factor is used which will vary depending on the nature of the solution. These conversion factors can be calibrated, usually using NaCl solutions. If a NaCl solution is used that makes the assumption that the main ions present are Na+ and Cl-. See [1] for more information.
Conductivity and temperature
Conductivity increases with temperature. This increase is significant, between 1.5 and 5.0% per °C. So, if you measure the same solution at different temperatures you will get a different conductivity unless a temperature correction is used. For this reason, conductivity readings must be temperature compensated.
Temperature compensation is generally carried out by adjusting the readings to a reference temperature, typically 25°C. Conductivity probes should have an integrated temperature sensor to aid this compensation.
There are two main temperature correction algorithms in common use [4,5,6]:
- Linear temperature coefficient: used in most applications
- Non-linear temperature coefficient: used when measuring low conductivity water
Neither of these are perfect, and so ideally all your solutions would be measured at the same, reference temperature. However, that is clearly not always possible. Errors in temperature measurement will also contribute to issues in compensation and so it is vital to let your conductivity probe and solution come into thermal equilibrium.
Temperature coefficient
The change in conductivity with temperature is expressed as the change in conductivity (as a percentage) per degree celsius. This is generally referred to as the temperature coefficient (α). The value of α varies depending on solution, solution concentration, and temperature (see Table 1 & 2).


The linear temperature correction is widely used. It is based on the observation that the conductivity of an electrolyte changes by the same percentage for every °C change in temperature. A single temperature coefficient can only be used with reasonable
accuracy over a small range of 30° or 40°C. The most accurate way is to calculate a coefficient specifically for the sample temperature for your solution. Tabulated values can vary for the same solution depending on source.
To calculate a coefficient one method is described below (see [5] or [8] for more details):
- Check the conductivity of a representative sample at a reference temperature (generally 25°C). This temperature is generally the temperature your calibration standard is quoted at.
- Using the same sample, find the conductivity at another temperature. Generally this is the temperature you will be measuring other samples at.
- Calculate the percent change per °C
- Enter this value into the settings of the meter.
Measuring conductivity
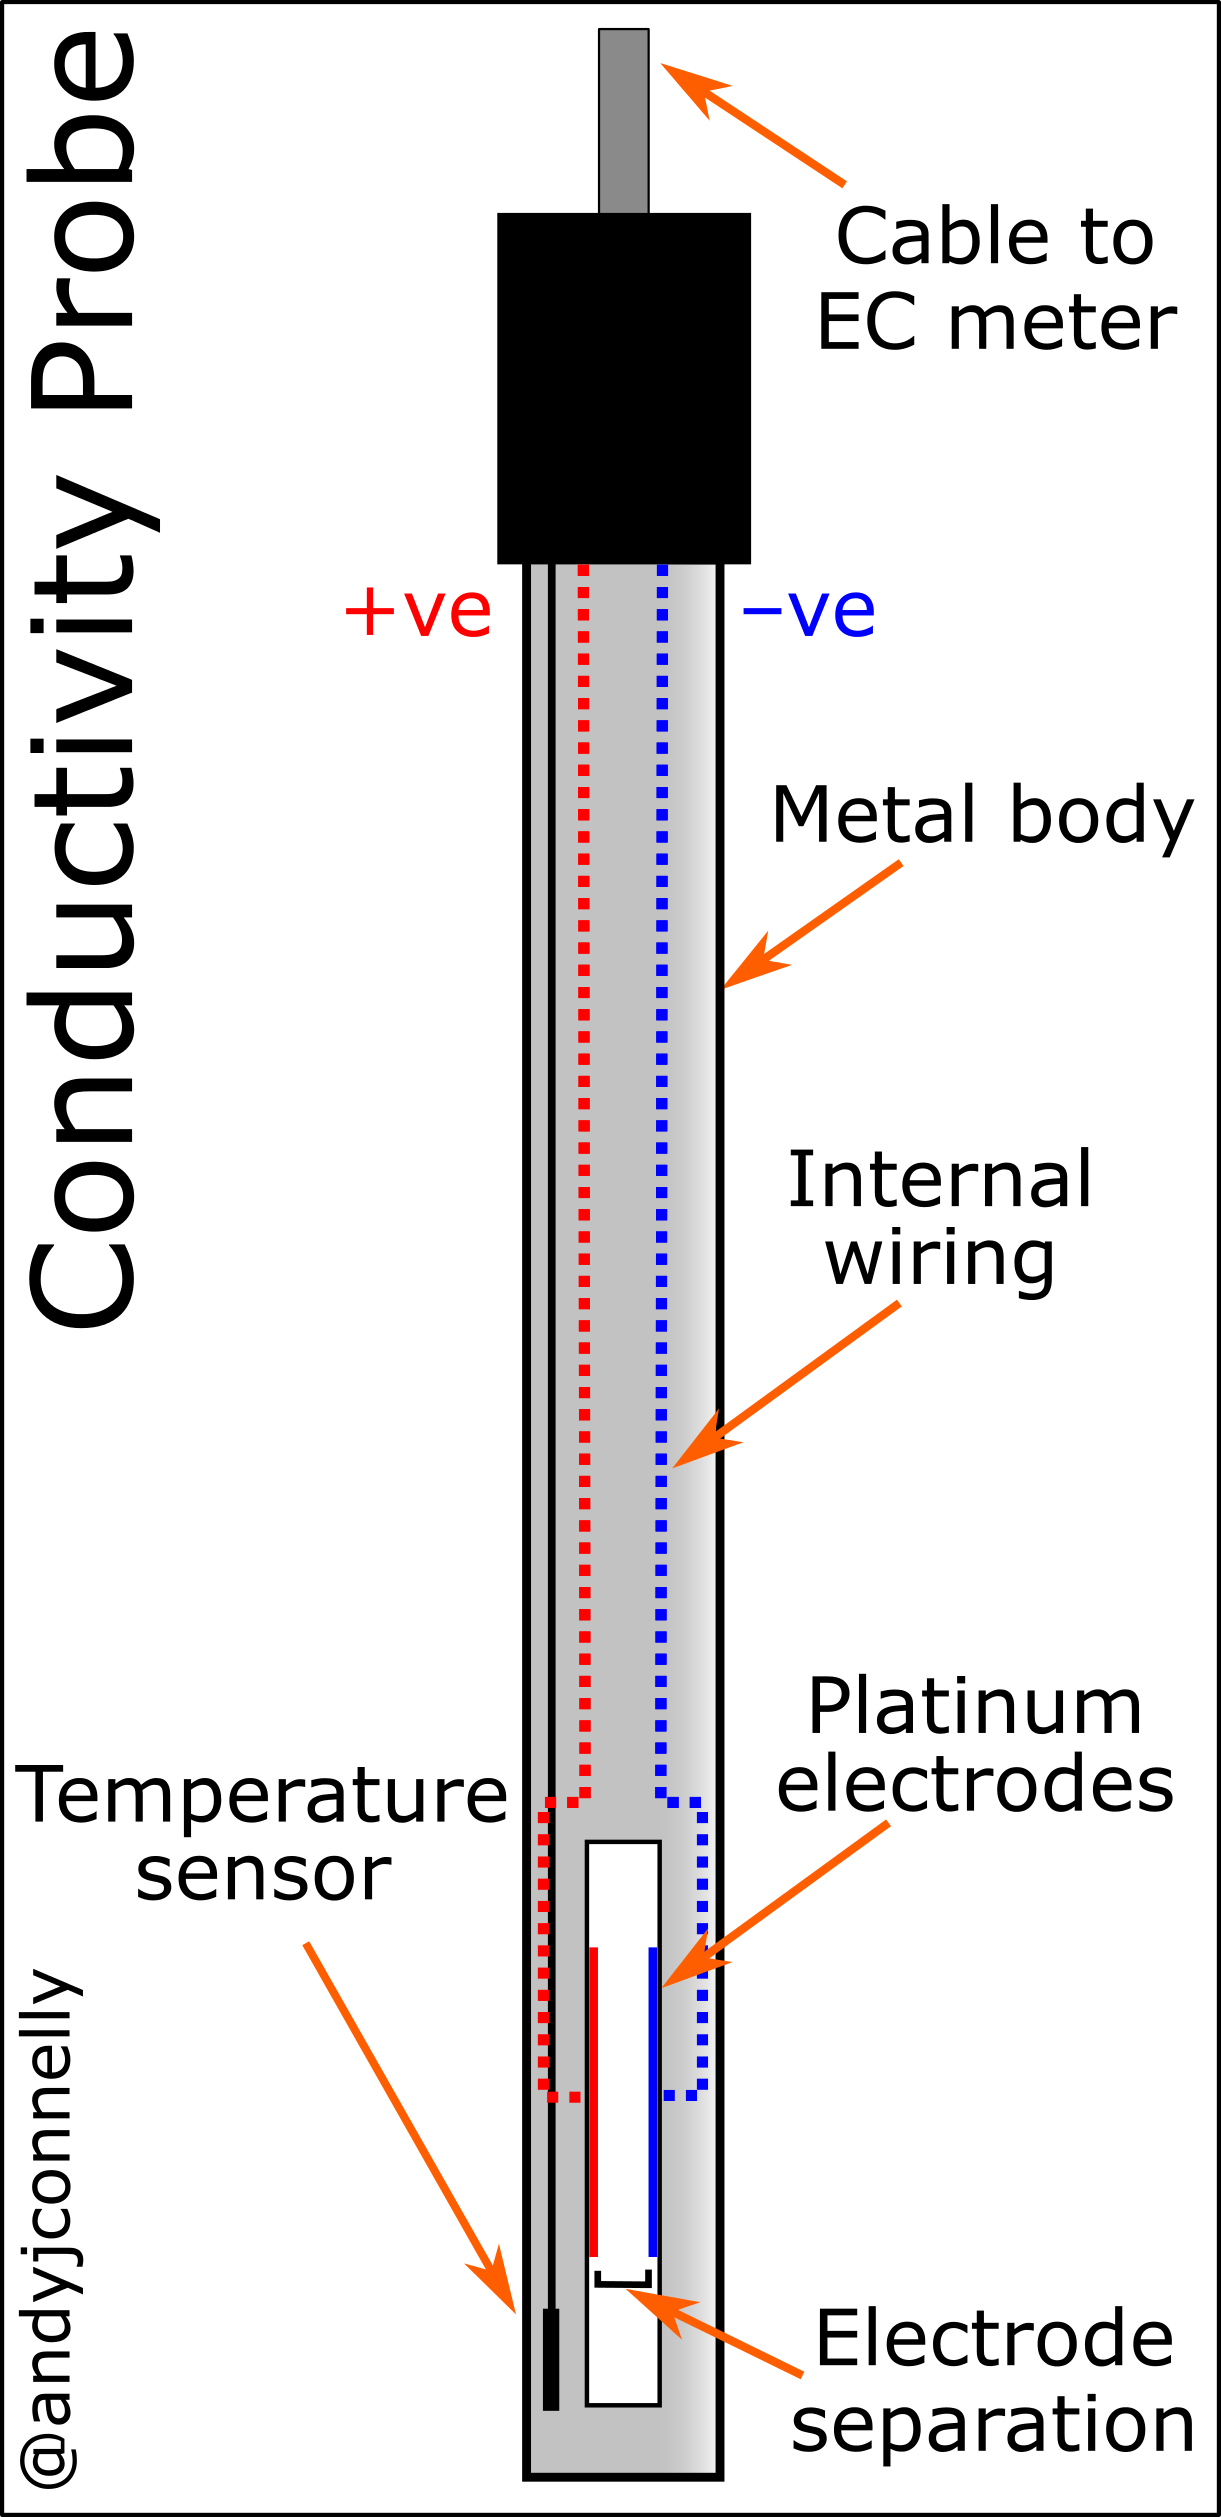
Measuring conductivity can be achieved in a variety of ways. The most common method is using a conductivity probe as seen in Figure 1. These use two or more platinum electrodes and measure the conductivity directly.
The other main method used for measuring conductivity is the toroidal “inductive” method. More information can be found on this in references [2] & [5].
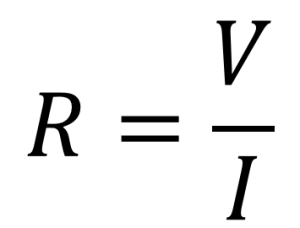
In the simplest arrangement of a platinum electrode type probe (a 2-electrode cell), a voltage is applied to two flat plates immersed in the solution, and the resulting current is measured and then conductivity, G, can then be calculated using inverted Ohm’s law [5]. Where R is the resistance, V = voltage and I = current:
 and
and 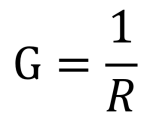
In principle a DC voltage could be used. However, a DC voltage would soon deplete the ions near the plates, causing polarization, and a higher than actual resistance to be measured. As such, an AC voltage is generally used to avoid this problem (see ref. [3] for more details).
A more advanced conductivity cell uses four electrodes (see Figure 2). These probes use an alternating current through the outer electrodes and measures the voltage across the inner electrodes [5]. The four electrode system gives a lower current and so has less charge transfer at the metal-liquid interface. This allows a much wider dynamic range to be measured than a two-electrode sensor. Such measurements are volume dependent and the outer sheath of the probe ensures that the volume of sample solution remains constant for all analysis.

Conductivity cell
Figure 3 shows the set up of a basic conductivity probe with two square platinum electrodes. The specific design of the probe will vary depending on the range of conductivities to be measured. The area of the electrodes and the distance between them defines this range. These values are encapsulated in the Cell Constant, K.
The conductivity, C, between electrodes in given by the expression:
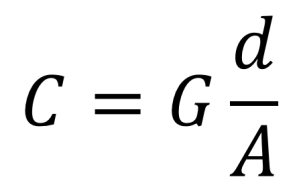
C = conductitivty (S/cm), G = conductance (S), d = distance between electrodes (cm), and A = plate area of electrodes (cm2).

Cell constant
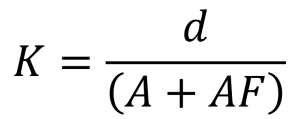
The cell constant (K) is defined as the ratio of the distance between the electrodes (d) to the electrode area (A). However, the fringe-field effect (AF) alters the electrode area, therefore:
For solutions with low conductivity the electrodes can be placed closer together or made larger so that the cell constant is less than one. This has the effect of raising the conductance to produce a value more easily interpreted by the meter. The reverse also applies, in high conductivity solutions, the electrodes are placed farther apart or made smaller to reduce the conductance of the sample.
The ideal K value for a probe varies with the range of conductances being measured. Typically, a cell with K = 0.1 cm–1 is chosen for pure water measurements, while for environmental water and industrial solutions. Cells with up to K = 10 cm–1 are better for very high conductivity samples (see Figure 1).
In theory, the cell constant can be applied directly out of the box without calibration. Unfortunately, the fringe field, and other effects, can result in the cell constant varying as much as 10% from the nominal cell constant; it may also vary over time. This means that the cell constant has to be calculated using a standard solution with a known conductivity (see below).
Choice of probe
The key decision in choosing a probe is the cell constant. Different cell constants will cover different ranges of conductance. Details of this are given above. Otherwise, the choice depends on issues including [5]:
- Robustness of the probe
- Probe body material
- Precision level you require,
- Various other factors depending on the probe and meter which will vary between manufacturer.
Cleaning and replatinization
Your probe may require cleaning if it becomes contaminated, details of this process can be found in references [3] & [5].
Some probes have a coating of platinum black on the surface of some platinum electrodes to create a more effective surface area for conductivity measurements. If a probe is treated badly the platinum may require replatinization.
Replatinization is required when measurements become slow, erratic or inconsistent or when the cell constant shifts more than 10% from the nominal cell constant. Platinizing the cell deposits a complete, fresh layer of platinum black on the plate surface that restores performance and reliability. A kit can normally be purchased for this task depending on the manufacturer of your probe.
Storage
Conductivity probes should be rinsed in deionised water between measurements. The probe can be stored in the deionised water between measurements; however, for overnight storage, or longer term storage, the probe should be rinsed and stored dry. The probe can be dried carefully using appropriate tissue.
Standards for conductivity
It is generally accepted that a one-point calibration of the cell constant at a representative conductivity is sufficient for accurate conductivity readings. If the samples cover a large range of conductivity levels, one or more points can be made.
Calibration frequency depends on the type of conductivity cell and application. It does not generally need to be done as regularly as for pH measurements using a pH probe.
Conductivity standards are usually sodium chloride solutions of various concentrations. These can be purchased or you can also prepare them yourself; however, this is not recommended (see [3] for details).
Summary
Conductivity is a useful value in many applications. The conductivity probe is a useful way of measuring this value so long a few important ideas are taken into account [see 5 for more details]:
- The correct probe should be chosen for the conductivity range of interest.
- The probe must be calibrated
- Conductivity is temperature-dependent, so time must be allowed for the conductivity sensor to equilibrate to the same temperature as the sample.
- The temperature of solution should be measured
- The appropriate temperature correction applied
If these five factors are taken into account then your conductivity measurements will be quick easy and more importantly, reliable.
References and further reading
- A Guide to Conductivity and dissolved oxygen,
- Moore 2004, Streamline Watershed Management Bulletin 8(1) 11-15
[1] http://www.fondriest.com/environmental-measurements/parameters/water-quality/conductivity-salinity-tds/ (accessed June 2017)
[2] THEORY AND APPLICATION OF CONDUCTIVITY, Application Data Sheet ADS 43-018/rev.D January 2010
[3] Shreiner R.H. & Pratt K.W. Primary Standards and Standard Reference Materials for Electrolytic Conductivity. NIST Special Publication 260-142, 2004.
[4] Thermo scientific, Smart notes, SN-CONDMETER-E 0514 RevA, 2014.
[5] Radiometer analytical, Conductivity: Theory and Practice, D61M002.
[6] Barron, J.J. & Ashton C., The effect of Temperature on conductivity measurement, TSP-07 Issue 3
[7] Table of concentration vs conductivity, accessed June 2017.
[8] Metler Toledo, Reducing Common Errors in Conductivity Measurement, 2012

Good but can u describe the curves and have some worked out example
From above: “Resistivity is the resistance measured across a specified distance (**measured in Siemens per centimeter (Ωcm)**). This is the reciprocal of conductivity.”
Not an expert either, but the asterisked bit should read **measured in ohms x centimeter (Ω.cm)** [not siemens/cm]. Resistance in ohms (Ω) is, as stated, the reciprocal of conductance, in siemens (S).